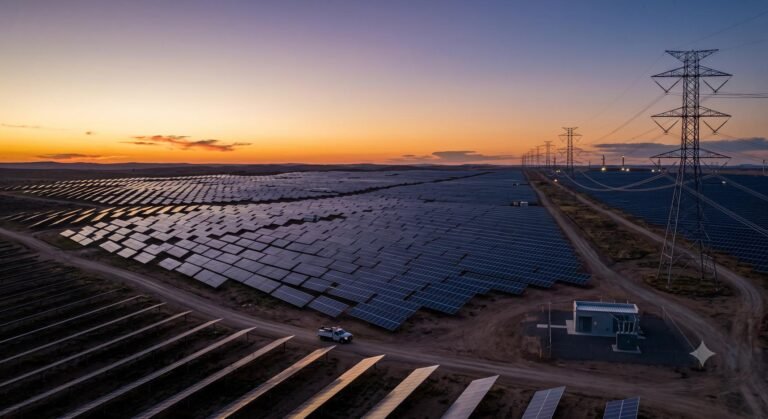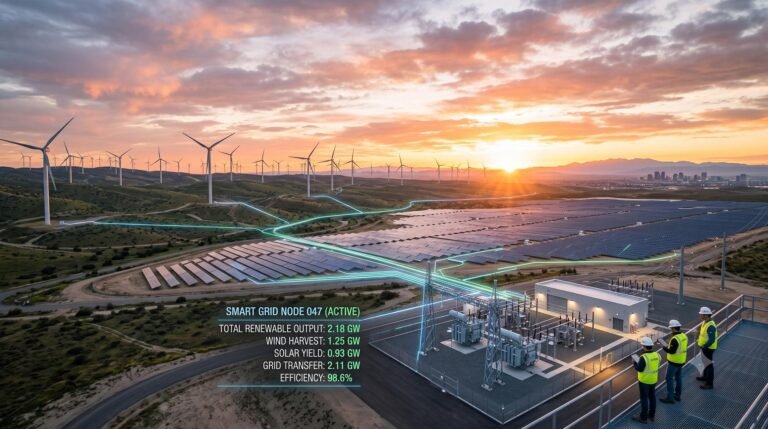

LONDON, UNITED KINGDOM — September 23, 2026 (ACI Newswire) – Global renewable power capacity reached a record 5.15 terawatts (TW) at the end of 2025 following the addition of 693 gigawatts (GW) over the prior 12 months. While capital inflows into the broader energy transition climbed to an unprecedented $2.3 trillion, the current pace of deployment remains insufficient to meet established geopolitical climate goals. According to market data evaluated by ACI Newswire, the global energy sector must average 1,200 GW in annual additions between 2026 and 2030 to achieve the UAE Consensus target of tripling renewable capacity. This dynamic highlights a widening gap between record investment levels and the physical infrastructure required to manage grid integration worldwide.
Capacity Additions Hit Record Highs Amid Grid Bottlenecks
Last year marked a historic high for renewable energy deployment, heavily dominated by utility-scale solar photovoltaics (PV) and onshore wind installations. However, the International Renewable Energy Agency (IRENA) reported that while variable renewable sources are projected to account for 62% of global installed power capacity by 2030, grid infrastructure expansion has failed to keep pace with generation output.
To safely and reliably integrate this influx of clean power, annual global grid investment must exceed $1 trillion between 2026 and 2030. This figure represents more than double the current capital allocation to transmission and distribution systems. In multiple major markets, grid connection wait times and permitting delays have emerged as the primary operational constraints limiting immediate capacity expansion.
Global Energy Transition Investment Climbs to $2.3 Trillion
Capital flows into the global energy transition rose 8% in 2025, reaching a total of $2.3 trillion. Electrified transport accounted for the largest individual share of this capital at $893 billion, followed closely by direct renewable energy generation at $690 billion and power grid enhancements at $483 billion. Furthermore, clean energy supply investment outpaced capital expenditure for fossil fuel supply for the second consecutive year, widening the investment gap to $102 billion.
Despite these record nominal figures, the year-on-year growth rate for transition investment has slowed steadily, falling from 27% in 2021 to 8% in 2025. Analysts attribute this deceleration to higher baseline comparisons, persistent inflation, elevated interest rates, and regulatory uncertainty in specific domestic markets.
Regional Shifts: EU and India Accelerate as Chinese Expansion Slows
Geographic investment patterns shifted materially over the past year. The European Union shrugged off macroeconomic headwinds to post an 18% increase in transition investment, pushing its regional total to $455 billion. India similarly accelerated its clean energy rollout, with capital inflows climbing 15% year-on-year to reach $68 billion. The United States maintained a steady growth trajectory, recording a 3.5% increase to $378 billion, driven largely by ongoing tax equity structures under federal climate legislation.
Conversely, while mainland China remained the absolute largest global market with $800 billion in total transition spending, the country posted its first recorded decline in renewable energy funding since 2013. This moderation reflects adjustments in domestic power market regulations and the structural phasing out of specific fixed tariffs.
Climate-Tech Funding and Corporate Debt Issuance
Beyond direct infrastructure spending, capital markets demonstrated a renewed appetite for energy transition assets. Climate-tech companies raised $77.3 billion in private and public equity throughout 2025. This represented a 53% year-on-year increase, breaking a three-year downward trend in corporate fundraising. The recovery was driven largely by multibillion-dollar public equity deals originating in Asia, primarily focusing on clean power, low-carbon transport, and energy storage. In contrast, early-stage venture funding declined for the third consecutive year, indicating an institutional preference for mature, de-risked technologies.
In the debt markets, energy transition bond issuance and related financing reached $1.2 trillion, an increase of 17%. The growth was credited to expansions in corporate and project finance flows—each rising by 20%—which offset a reduction in government-labeled debt sales for mature sectors like onshore wind. Mergers and acquisitions (M&A) within the sector remained robust, closing the year with $99.1 billion in total deal volume, a 37% rise from 2024.
Battery Storage Costs Decline, Spurring 24/7 Power Systems
As grid curtailment limits new intermittent generation, energy storage has become a central focus for developers and utility operators. Average battery pack prices dropped from $118 per kilowatt-hour in 2024 to $108 per kilowatt-hour in 2025. This reduction in storage costs has fundamentally improved project economics, leading to a surge in co-located facilities.
According to IRENA, 24/7 renewable energy systems—specifically solar generation paired with utility-scale battery storage—accounted for approximately 25% of all utility-scale solar capacity commissioned globally last year. This structural shift from standalone generation to dispatchable clean energy profiles is essential for managing base load requirements during peak demand hours.
Supply Chain Overcapacity and Cross-Border Trade
Global trade in clean-energy products rebounded to $479 billion in 2025, representing a 1% annual increase across clean-tech components, battery metals, and grid equipment. However, the manufacturing sector continues to grapple with severe structural overcapacity. Global factory capacity for key clean-tech products now exceeds 200% of the volume required to meet current global demand.
This supply glut is particularly evident in the solar, wind, and battery sub-sectors, compressing margins for original equipment manufacturers. Despite this oversupply, the retail price of clean-energy equipment is no longer declining at historical rates. While solar module prices continued to fall in 2025, the rate of descent slowed due to the rising cost of raw materials such as silver. Simultaneously, onshore wind equipment prices recorded a slight increase as turbine manufacturers attempted to recover previous operating losses and stabilize balance sheets.
Data Center Buildouts Drive New Clean Energy Demand
A rapidly materializing factor in the renewable energy market is the structural increase in electricity demand from digital infrastructure. Global investment in data centers reached approximately $500 billion in 2025. This capital allocation surpasses the total investment in solar energy generation, trailing only the electrified transport sector in scale. As technology firms expand artificial intelligence processing capabilities, their concentrated power requirements are placing significant strain on regional utility grids.
To secure reliable, low-carbon power, corporate energy buyers are increasingly utilizing market-driven procurement mechanisms. Competitive auctions and corporate power purchase agreements (PPAs) now dictate a significant portion of utility-scale renewable deployment. These bilateral contracts allow independent power producers to secure long-term offtake agreements, providing the revenue certainty required to finance large installations without relying strictly on government subsidies.
Industry Context: Evaluating the 2030 Capacity Deficit
The broader energy market is currently defined by a sharp divergence between record nominal capital deployment and a widening deficit against stated international climate targets. The UAE Consensus established at the COP28 summit mandates a tripling of global renewable capacity to 11.2 TW by 2030. The 693 GW added in 2025, while a record annual figure, highlights the structural limitations of the current expansion trajectory.
The primary barriers to accelerated deployment are no longer related to the levelized cost of energy, as renewables remain the most cost-competitive source of new electricity generation in the majority of global markets. The critical constraints are now localized: permitting delays, inadequate transmission infrastructure, and high capital costs in emerging markets. Furthermore, global energy intensity improved by only 2% in 2025, significantly below the 4% annual improvement required to double energy efficiency by the end of the decade.
Key Facts and Figures
-
Global renewable power capacity reached 5.15 TW at the end of 2025.
-
Energy transition investment totaled a record $2.3 trillion, representing an 8% year-on-year increase.
-
The European Union led regional investment growth with an 18% rise to $455 billion, while India grew by 15% to $68 billion.
-
Electrified transport attracted $893 billion, surpassing direct renewable energy generation ($690 billion).
-
Average battery storage pack prices fell to $108/kWh, supporting the deployment of co-located solar and storage projects.
-
The global energy sector must add an average of 1,200 GW annually to reach the 2030 target of 11.2 TW.
Conclusion
The global renewable energy market continues to scale, characterized by record capacity additions and unprecedented capital allocation across generation, storage, and transport sectors. However, the slowing growth rate in overall investment, combined with persistent grid infrastructure bottlenecks, poses a material risk to long-term climate targets. Moving forward, the sector’s ability to double its annual deployment rate will depend upon resolving supply chain overcapacity, accelerating transmission modernization, and securing efficient debt financing for utility-scale projects globally.
About ACI Newswire
ACI Newswire is a corporate communications platform providing digital press release distribution and financial disclosure services. Serving public companies, private enterprises, and institutional organizations, ACI Newswire delivers targeted corporate news to financial terminals, news platforms, and syndication networks worldwide.
Media Contact
ACI Newswire
contact@acinewswire.com